0x01. 案例背景
评估订阅或奖励计划对客户的影响的例子。
假设一个网站有会员奖励计划,如果客户注册,他们会得到额外的好处。我们如何知道该会员奖励计划是有用的?翻译成因果推断即:提供会员注册计划对总销售额有什么影响?
该问题的反事实问题是,如果没有会员注册计划,他们在网站上的花费会少多少?
该问题在因果推理中,我们感兴趣的是被施加干预者的平均干预效果(Average Treatment Effect on the Treated,ATT)。
0x02. 对因果模型建模
假设奖励计划于2019年1月推出。结果变量是年底的总支出。我们拥有每个用户的所有月交易数据,以及那些选择注册奖励计划的用户的注册时间。具体数据信息如下:
# Creating some simulated data for our example
import pandas as pd
import numpy as np
num_users = 10000
num_months = 12

# signup_months == 0 means customer did not sign up
signup_months = np.random.choice(np.arange(1, num_months), num_users) * np.random.randint(0,2, size=num_users)
df = pd.DataFrame({
    'user_id': np.repeat(np.arange(num_users), num_months),
    'signup_month': np.repeat(signup_months, num_months), # signup month == 0 means customer did not sign up
    'month': np.tile(np.arange(1, num_months+1), num_users), # months are from 1 to 12
    'spend': np.random.poisson(500, num_users*num_months) #np.random.beta(a=2, b=5, size=num_users * num_months)*1000 # centered at 500
})
# A customer is in the treatment group if and only if they signed up
df["treatment"] = df["signup_month"]>0
# Simulating an effect of month (monotonically decreasing--customers buy less later in the year)
df["spend"] = df["spend"] - df["month"]*10
# Simulating a simple treatment effect of 100
after_signup = (df["signup_month"] df.loc[after_signup,"spend"] = df[after_signup]["spend"] + 100
df
数据内容如下:
|
user_id
|
signup_month
|
month
|
spend
|
treatment
|
|
0
|
0
|
0
|
1
|
472
|
False
|
|
1
|
0
|
0
|
2
|
479
|
False
|
|
2
|
0
|
0
|
3
|
490
|
False
|
|
3
|
0
|
0
|
4
|
476
|
False
|
|
4
|
0
|
0
|
5
|
427
|
False
|
|
…
|
…
|
…
|
…
|
…
|
…
|
|
119995
|
9999
|
8
|
8
|
454
|
True
|
|
119996
|
9999
|
8
|
9
|
526
|
True
|
|
119997
|
9999
|
8
|
10
|
489
|
True
|
|
119998
|
9999
|
8
|
11
|
485
|
True
|
|
119999
|
9999
|
8
|
12
|
513
|
True
|
0x03. 注意时间重要性
建模该问题,时间充当着重要的角色。注册奖励机制可以影响未来的交易,但不会影响之前发生的交易。事实上,在注册奖励之前的交易可以被认为是导致奖励注册决策的原因。因此,我们将每个用户的变量分开:
- treatment之前的活动(假设是treatment的原因)
- treatment之后的活动(假设是treatment的结果)
当然,许多影响注册和总支出的重要变量(variables)都被忽略了(例如,购买的产品类型、用户帐户的长度、地理位置等)。这是分析中的一个关键假设,需要稍后使用反驳测试来验证。因此,在实验中需要一个节点表示未观测到的混淆因子(Confounders)。
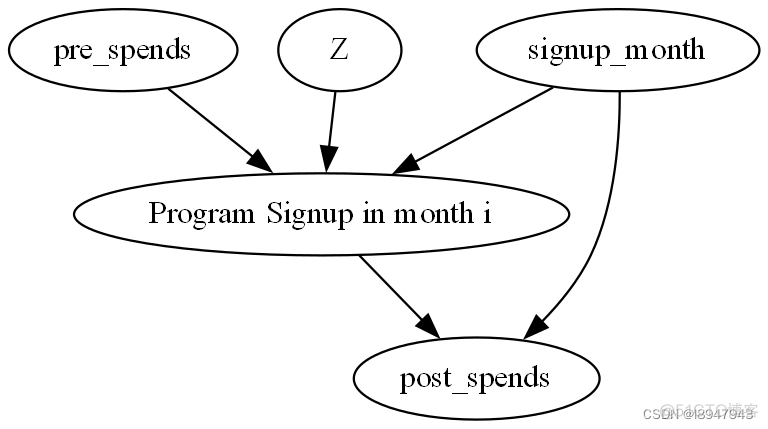
下面是在第i=3个月注册的用户的因果图。对任何i的分析都是类似的。
import dowhy

# Setting the signup month (for ease of analysis)
i = 3

causal_graph = """digraph {
treatment[label="Program Signup in month i"];
pre_spends;
post_spends;
Z->treatment;
pre_spends -> treatment;
treatment->post_spends;
signup_month->post_spends;
signup_month->treatment;
}"""
# Post-process the data based on the graph and the month of the treatment (signup)
# For each customer, determine their average monthly spend before and after month i
df_i_signupmonth = (
    df[df.signup_month.isin([0, i])]
    .groupby(["user_id", "signup_month", "treatment"])
    .apply(
        lambda x: pd.Series(
            {
                "pre_spends": x.loc[x.month                 "post_spends": x.loc[x.month > i, "spend"].mean(),
            }
        )
    )
    .reset_index()
)
print(df_i_signupmonth)
model = dowhy.CausalModel(data=df_i_signupmonth,
                     graph=causal_graph.replace("n", " "),
                     treatment="treatment",
                     outcome="post_spends")
model.view_model()
from IPython.display import Image, display
display(Image(filename="causal_model.png"))
输出数据如下:
user_id  signup_month  treatment  pre_spends  post_spends
0           0             0      False       475.5   422.222222
1           1             0      False       507.5   429.333333
2           2             0      False       483.0   429.222222
3           4             0      False       452.0   431.444444
4           5             0      False       476.5   413.444444
...       ...           ...        ...         ...          ...
5460     9991             0      False       460.0   414.666667
5461     9992             0      False       471.5   426.000000
5462     9993             3       True       495.0   517.444444
5463     9997             0      False       512.0   419.888889
5464     9998             0      False       493.5   426.222222
构建的因果图如图:

更广泛的说,我们可以把任何用户相关的变量数据加到上图中。
0x04. 识别因果效应
在这个例子,让我们假设未观察到的混淆因子(Confounders)并没有发挥很大的作用。
identified_estimand = model.identify_effect(proceed_when_unidentifiable=True)
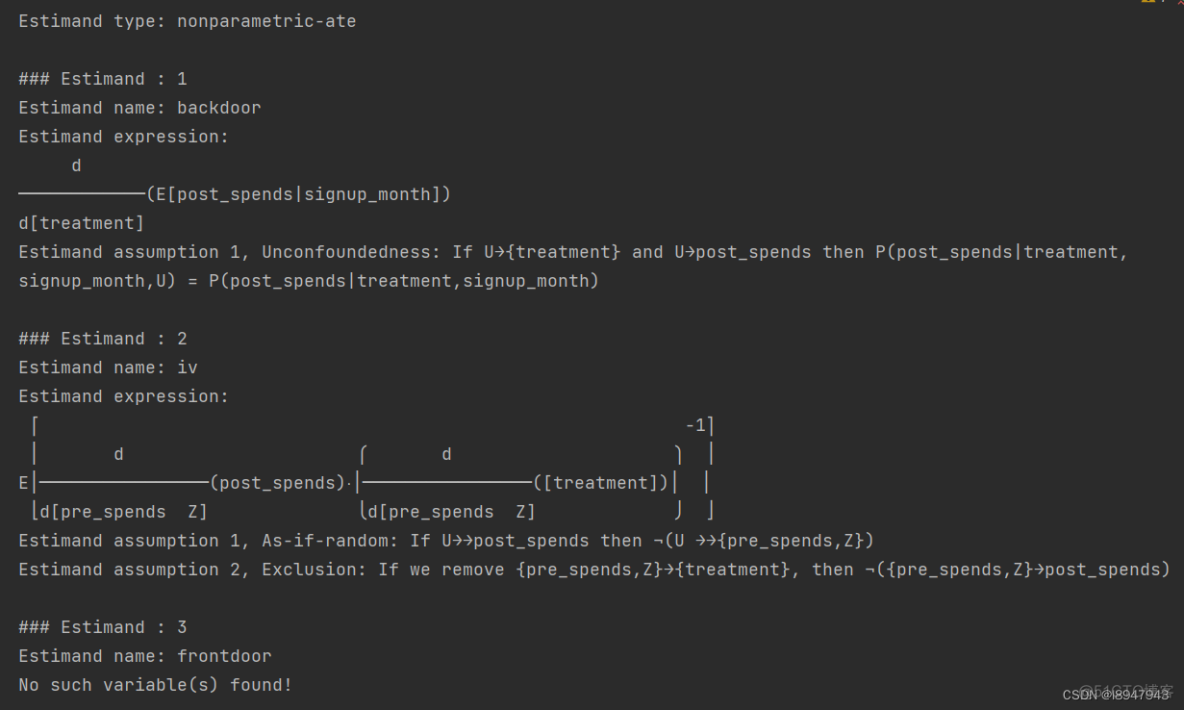
print(identified_estimand)
输出结果如下:

根据因果图(causal graph),使用DoWhy确定signup_month和pre_spend对用户注册月份有影响,需要可以作为识别到的原因。
0x05. 因果效应估计
estimate = model.estimate_effect(identified_estimand,
                                 method_name="backdoor.propensity_score_matching",
                                target_units="att")
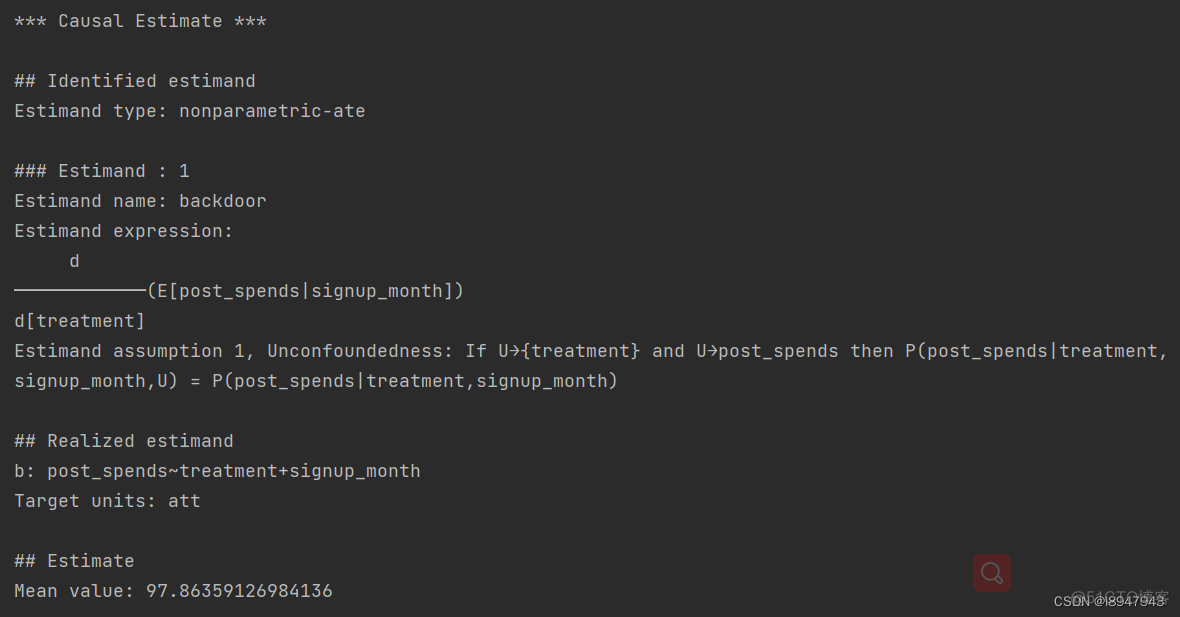
print(estimate)

分析展示了treatment平均处理效果(Average Treatment Effect on the Treated,ATT)。也就是说,在第i=3个月注册了奖励计划的客户对总支出的平均影响(与他们没有注册的情况相比)。通过改变i的值(上面的第2行),然后重新运行分析,我们可以类似地计算在其他任何月份注册的客户的影响。
注意,上述因果效应的估计可能受到left and right-censoring的影响:
-
Left-censoring:如果用户在第一个月注册,我们没有足够的交易数据将他们与未注册的相似用户进行匹配;
-
Right-censoring:如果用户在最后一个月注册,我们没有足够的未来相关数据来估计注册后的收入;
因此,即使注册的影响在所有月份中都是相同的,但是由于缺乏数据也可能是估计的结果因注册月份不同而有差异。
0x06. 反驳估计
我们使用安慰剂方式来refute这一估计结果,也即使用一个随机变量替换掉treatment,然后验证我们的估计结果是否会变为0。
refutation = model.refute_estimate(identified_estimand, estimate, method_name="placebo_treatment_refuter",
                     placebo_type="permute", num_simulations=20)
print(refutation)
输出结果如下:
Refute: Use a Placebo Treatment
Estimated effect:97.86359126984136
New effect:-4.618129960317461
p value:0.14934271076393213
0x07. 参考
- Estimating the Effect of a Member Rewards Program
- DoWhy实战—-Estimating the effect of a Member Rewards program
服务器托管,北京服务器托管,服务器租用 http://www.fwqtg.net
机房租用,北京机房租用,IDC机房托管, http://www.e1idc.net


