一、前言
前面我们了解了关于机器学习使用到的数学基础和内部原理,这一次就来动手使用 pytorch 来实现一个简单的神经网络工程,用来识别手写数字的项目。自己动手后会发现,框架里已经帮你实现了大部分的数学底层逻辑,例如数据集的预处理,梯度下降等等,所以只要你有足够棒的idea,你大部分都能相对轻松去实现你的想法。
二、实践准备
数据处理往往是放在所有工作的首位,比如这里使用到的 MNIST 数据集,MNIST 是由Yann LeCun等人提供的免费的图像识别的数据集,其中包含60000个训练样本和10000个测试样本,其中图的尺寸已经进行标准化的处理,都是黑白图像,大小为28*28。
在 pytorch 框架中自带数据集由两个上层的API提供,分别是 torchvision 和 torchtext,也就是视觉和文本。其中,torchvision提供了对照片数据处理相关的API和数据,数据所在位置:torchvision.datasets,比如torchvision.datasets.MNIST(手写数字照片数据);torchtext提供了对文本数据处理相关的API和数据,数据所在位置:torchtext.datasets,比如torchtext.datasets.IMDB(电影评论文本数据)。
我们直接对 torchvision.datasets.MNIST 进行实例化,就可得到Dataset的实例:
train_loader = torch.utils.data.DataLoader(
    torchvision.datasets.MNIST('./data', train=True, download=True,
                               transform=torchvision.transforms.Compose([
                                   torchvision.transforms.ToTensor(),
                                   torchvision.transforms.Normalize(
                                       (0.1307,), (0.3081,)
                                   )
                               ])),
    batch_size=batch_size, shuffle=True
)
在框架中提供的 DataLoader 方法中,只要实现了三个函数方法,分别是: init, len, and getitem,就可以定义数据如何加载到 torch 中。我们看看内置的 MNIST 中是怎么做的:
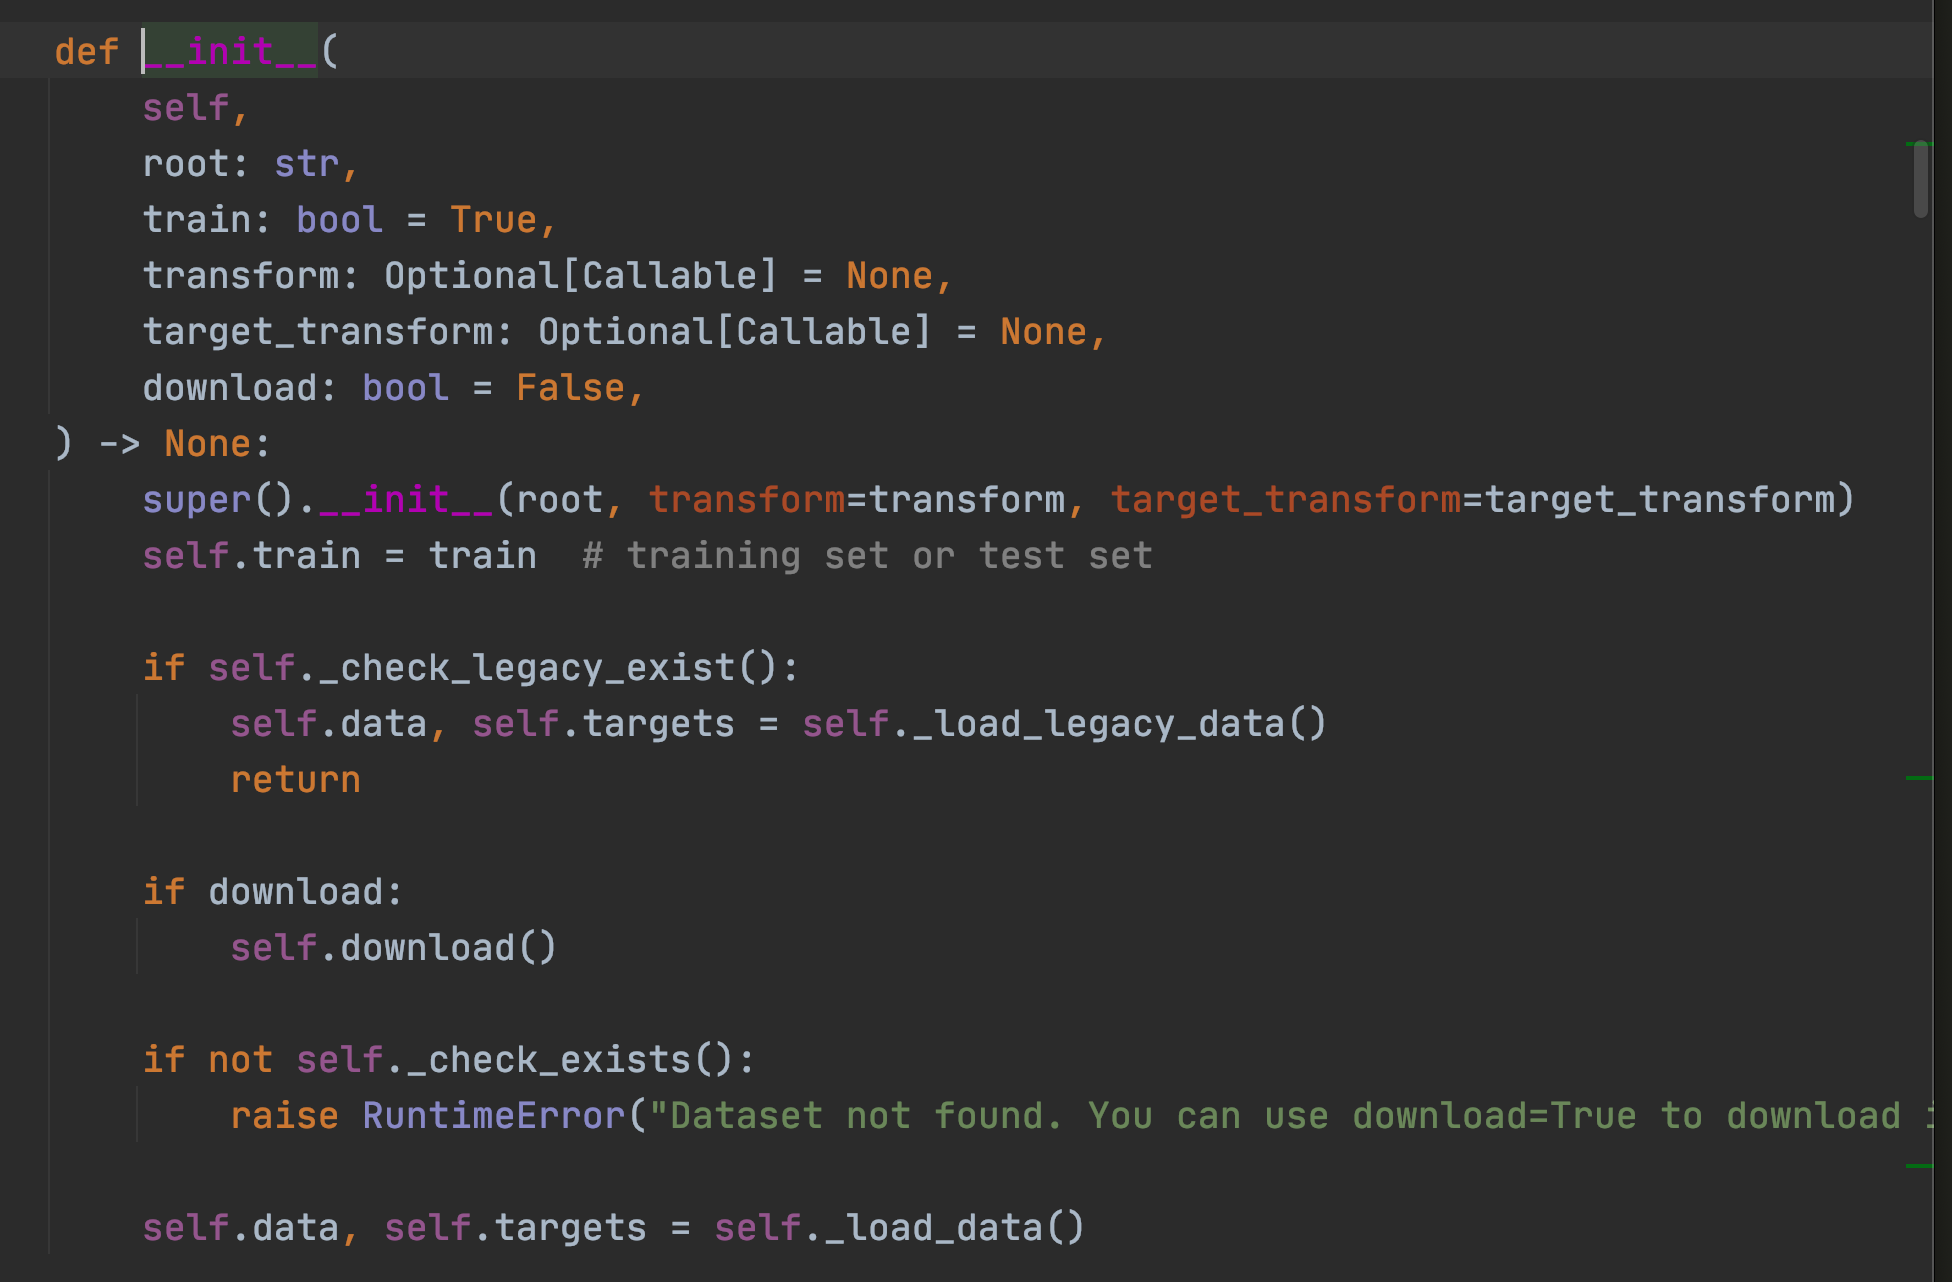
这里将 MNIST 数据源从远端下载,并且指定转化函数 transform,这里的 tranform 一般指的是对图片 resize 重新指定大小,然后变成框架中可以识别的张量等等。并且指定输入和输出的数据,在这里就是输入的是图片 data,输出的是这个图片的分类特质 target,比如 0-9 的分类标识。
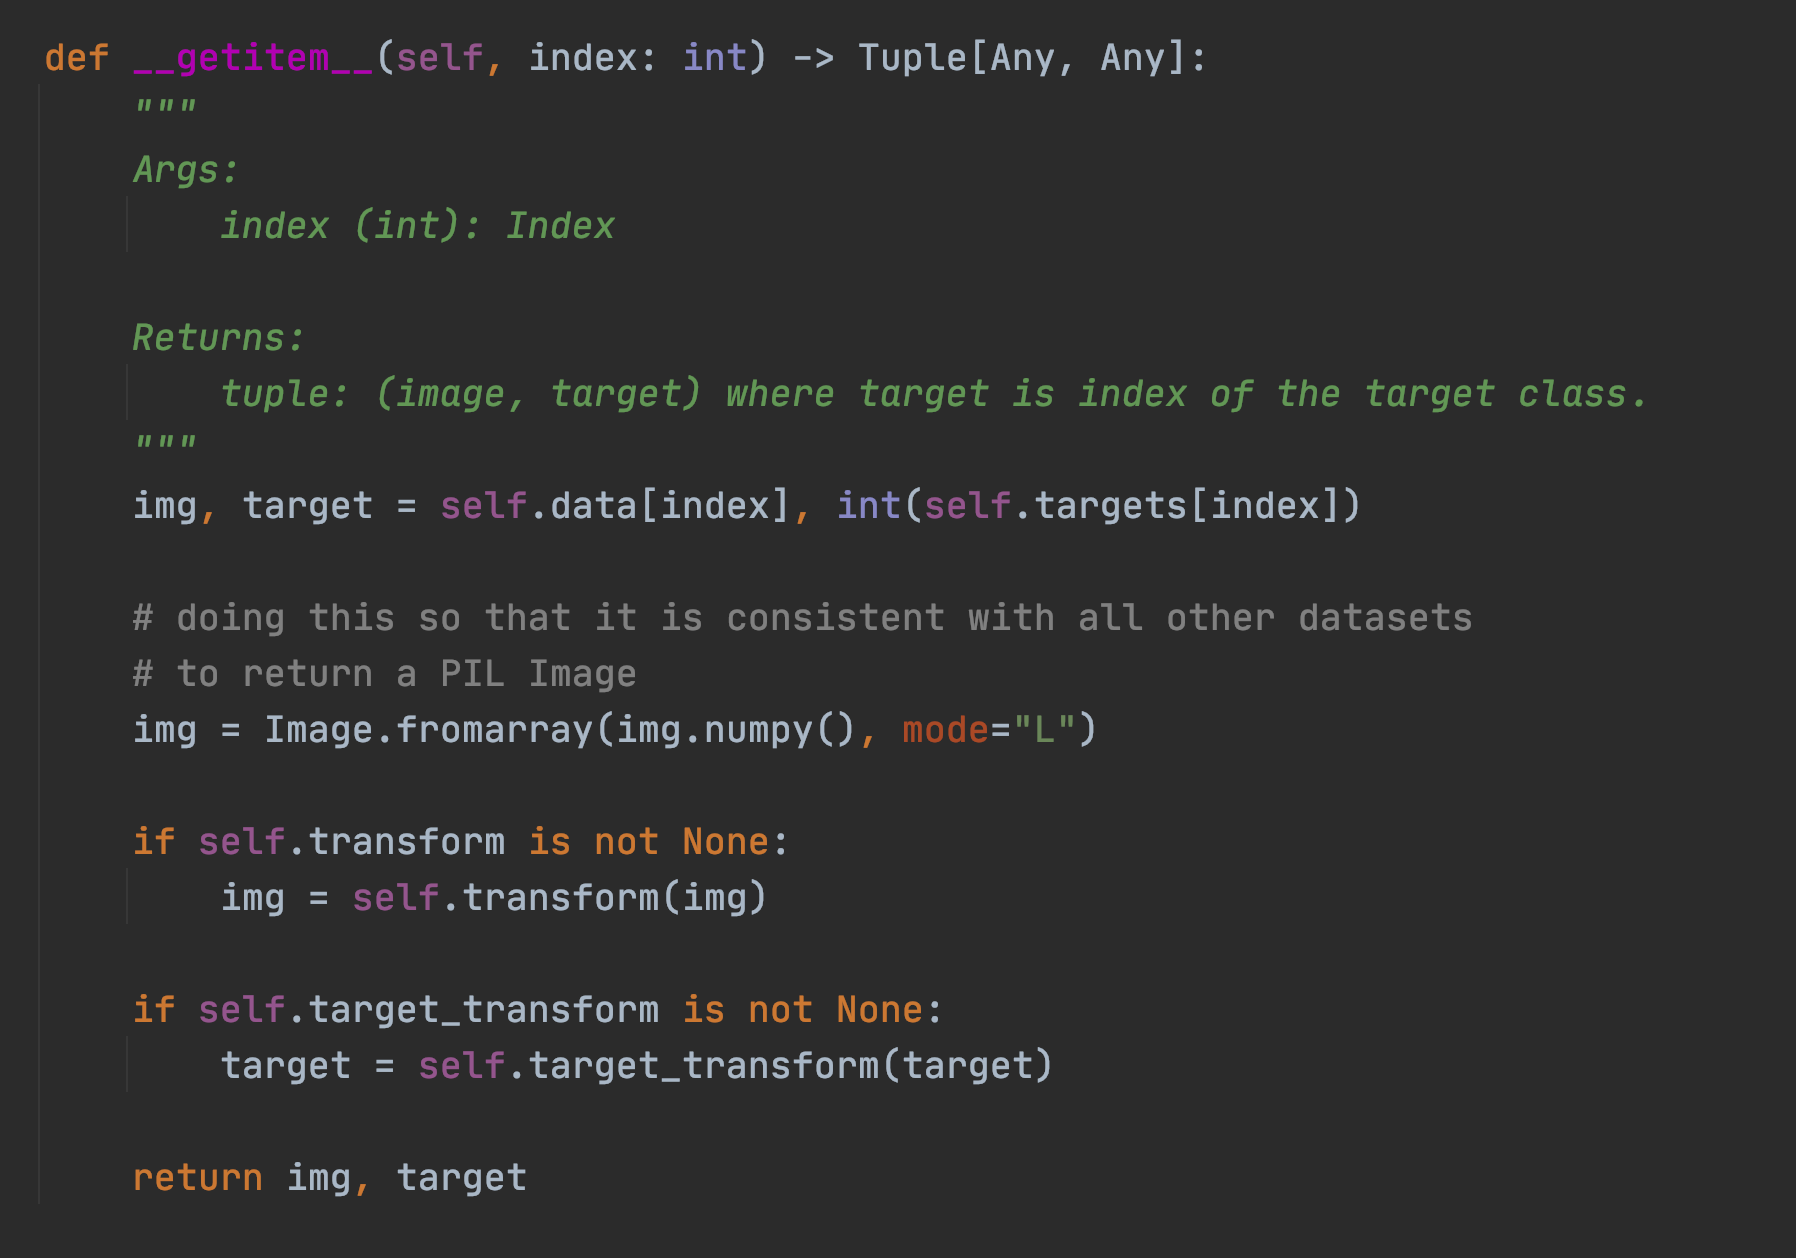
本质上 dataloader 是一个迭代器,可以在每次循环中返回处理过的批数据,而 getitem 方法保证了在原始图片能被处理过后进行返回,比如上面的将图片进行转换成矩阵数组,然后通过 transform 进行转变预处理,再返回输入和输出,这里指的是 img 和 target。

len 函数相对就比较简单了,返回data的数组长度。
在 dataset 数据集中还提供了 transforms 功能, 我们可以使用 transform=torchvision.transforms.Compose 方法来定义使用何种transforms 方法,这里框架会自动排序,而不用刻意担心执行的顺序。比如这里使用的是:
torchvision.transforms.ToTensor    // 可以把图像转变成 tensor 类型
torchvision.transforms.Normalize   // 归一化处理
对于 toTensor 方法,我们可以看看当一个 batch 的图片从 DataLoader 类处理过后,吐出来是怎样的数据结构:
# 展示一个 batch 的图片
x, y = next(iter(train_loader))
print(x.shape, y.shape, x.min(), x.max())
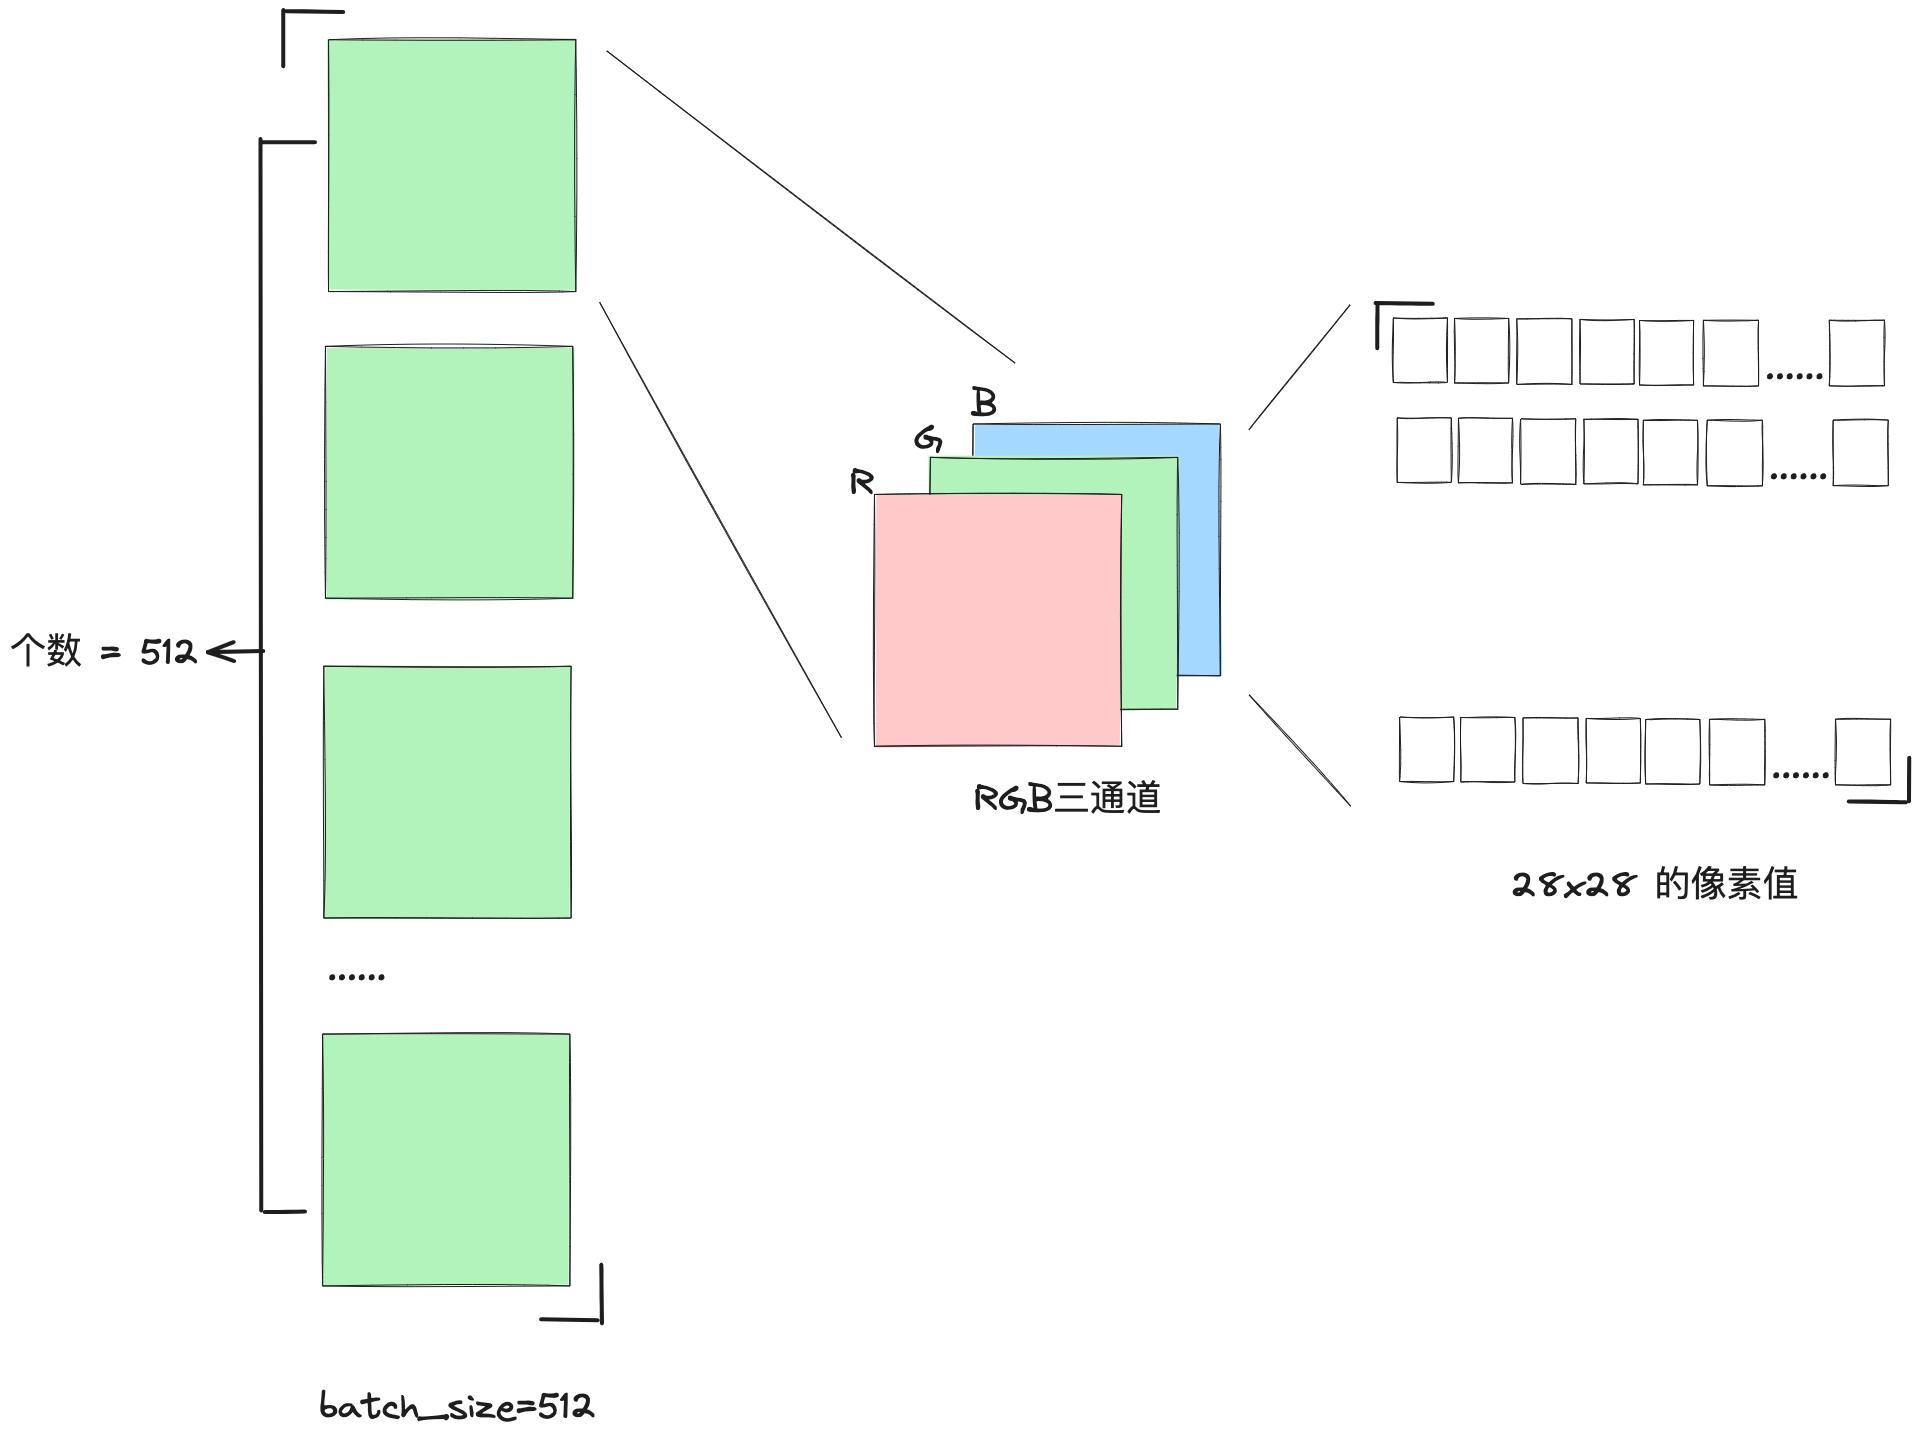
# torch.Size([512, 1, 28, 28]) torch.Size([512]) tensor(-0.4242) tensor(2.8215)
# 512张图,1通道,28*28像素,label大小512
plot_image(x, y, 'image sample')
刚开始看到 torch.Size 的值 [512, 1, 28, 28] 的时候,会觉得这也太抽象了~~ 为了尝试理解图片处理过后的张量形式,我花了一张图:
关于归一化处理的可以参考吴老师的这个视频,了解过后你就会立即明白为什么预处理需要加上归一化了:https://www.bilibili.com/video/BV1pm4y1T7wx/?p=26&spm_id_from=333.880.my_history.page.click&vd_source=122a8013b3ca1b80a99d763a78a2bc50
这里此处的 0.1307 和 0.3081 分别是数据集的均值和方差。在计算得到数据集的均值和方差后,我们可以使用标准化公式将数据标准化为标准正态分布N(0, 1)。标准化的公式如下:
Z = (X – ) /
其中,Z是标准化后的数据,X是原始数据,是原始数据的均值,是原始数据的标准差。
这个公式的作用是将原始数据集的均值变为0,标准差变为1。在这个过程中,每个原始数据值都会减去均值,然后再除以标准差。这样做的结果是,新的数据集(即标准化后的数据)的均值为0,标准差为1,也就是说,数据符合标准正态分布N(0, 1)。
在处理MNIST数据集时,我们已经得到了均值mean=0.1307和标准差std=0.3081,所以我们可以使用上述公式对数据集进行标准化。在上面代码中,我们使用torchvision.transforms模块中的Normalize函数来实现这个功能。
除此之外,transforms 还可以做很多图像上的变换,这里总结一共有四大类,方便以后索引:
1. 裁剪(Crop)
中心裁剪:transforms.CenterCrop
随机裁剪:transforms.RandomCrop
随机长宽比裁剪:transforms.RandomResizedCrop
上下左右中心裁剪:transforms.FiveCrop
上下左右中心裁剪后翻转,transforms.TenCrop
2. 翻转和旋转(Flip and Rotation)
依概率p水平翻转:transforms.RandomHorizontalFlip(p=0.5)
依概率p垂直翻转:transforms.RandomVerticalFlip(p=0.5)
随机旋转:transforms.RandomRotation
3. 图像变换(resize)transforms.Resize
标准化:transforms.Normalize
转为tensor,并归一化至[0-1]:transforms.ToTensor
填充:transforms.Pad
修改亮度、对比度和饱和度:transforms.ColorJitter
转灰度图:transforms.Grayscale
线性变换:transforms.LinearTransformation()
仿射变换:transforms.RandomAffine
依概率p转为灰度图:transforms.RandomGrayscale
将数据转换为PILImage:transforms.ToPILImage
将lambda应用作为变换:transforms.Lambda
4. 对transforms操作,使数据增强更灵活
从给定的一系列transforms中选一个进行操作:transforms.RandomChoice(transforms),
给一个transform加上概率,依概率进行操作 :transforms.RandomApply(transforms, p=0.5)
将transforms中的操作随机打乱:transforms.RandomOrder
三、搭建网络和计算
因为刚开始我服务器托管网们只是为了熟悉一下怎么使用 pytorch 来搭建一个简单的神经网络,所以这里我选择使用最简单的全连接,使用三层的网络来进行手写数字的识别。
# step 2 : 网络
class Net(nn.Module):
    def __init__(self):
        super(Net, self).__init__()

        # xw+b
        # 28*28 输入, 256 第一层的输出
        self.func1 = nn.Linear(28 * 28, 256)
        # 64 第二层输出
        self.func2 = nn.Linear(256, 64)
        # 10 分类输出 0~9
        self.func3 = nn.Linear(64, 10)

    def forward(self, x):
        x = F.relu(self.func1(x))
        x = F.relu(self.func2(x))
        x = self.func3(x)
        return x


net = Net()
# [w1, b1, w2, b2, w3, b3] 三个方程中需要优化的对象参数, lr - learning rate
optimazer = optim.SGD(net.parameters(), lr=0.005, momentum=0.9)
train_loss = []
nn.Linear 可以帮助我们创建一个线性回归方程,并且可以指定它输入和输出的变量个数。并且每一层全连接的线性函数都接着一个 relu 层,因为我们今天做的是分类的任务,所以使用 relu 会更好的提取到非线性的特征,最后能快速收敛到 0-9 这十个数字分类上去。
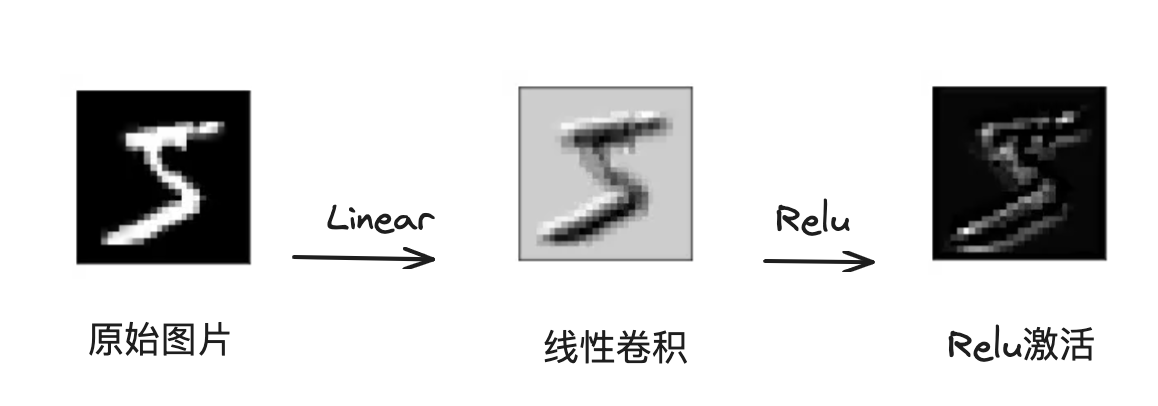
梯度下降的优化器则是使用的 SGD 算法,只需要声明学习率和动量值就可以了,接下来我们只需要硬train一发,计算过程如下:
# step 3 : 计算
for epoch in range(3):
    for batch_idx, (x, y) in enumerate(train_loader):
        # x: [b,  1, 28, 28], y: [512]
        # [b,  1, 28, 28] => [b, 784]
        x = x.view(-1, 28 * 28)
        # => [b, 0]
        out = net(x)
        # y_onehot 图片label的向量
        y_onehot = one_hot(y)

        # loss函数方差
        # loss = mse(out, y_onehot)
        loss = F.mse_loss(out, y_onehot)

        # 清零梯度
        optimazer.zero_grad()
        # 计算梯度
        loss.backward()
        # 更新梯度
        optimazer.step()

        train_loss.append(loss.item())

        if batch_idx % 10 == 0:
            print(epoch, batch_idx, loss.item())
在这个过程我们也可以关注 train_loss 的值,也就是每个 batch 训练后 loss 方程的minima 的值,我们使用图像进行展示:
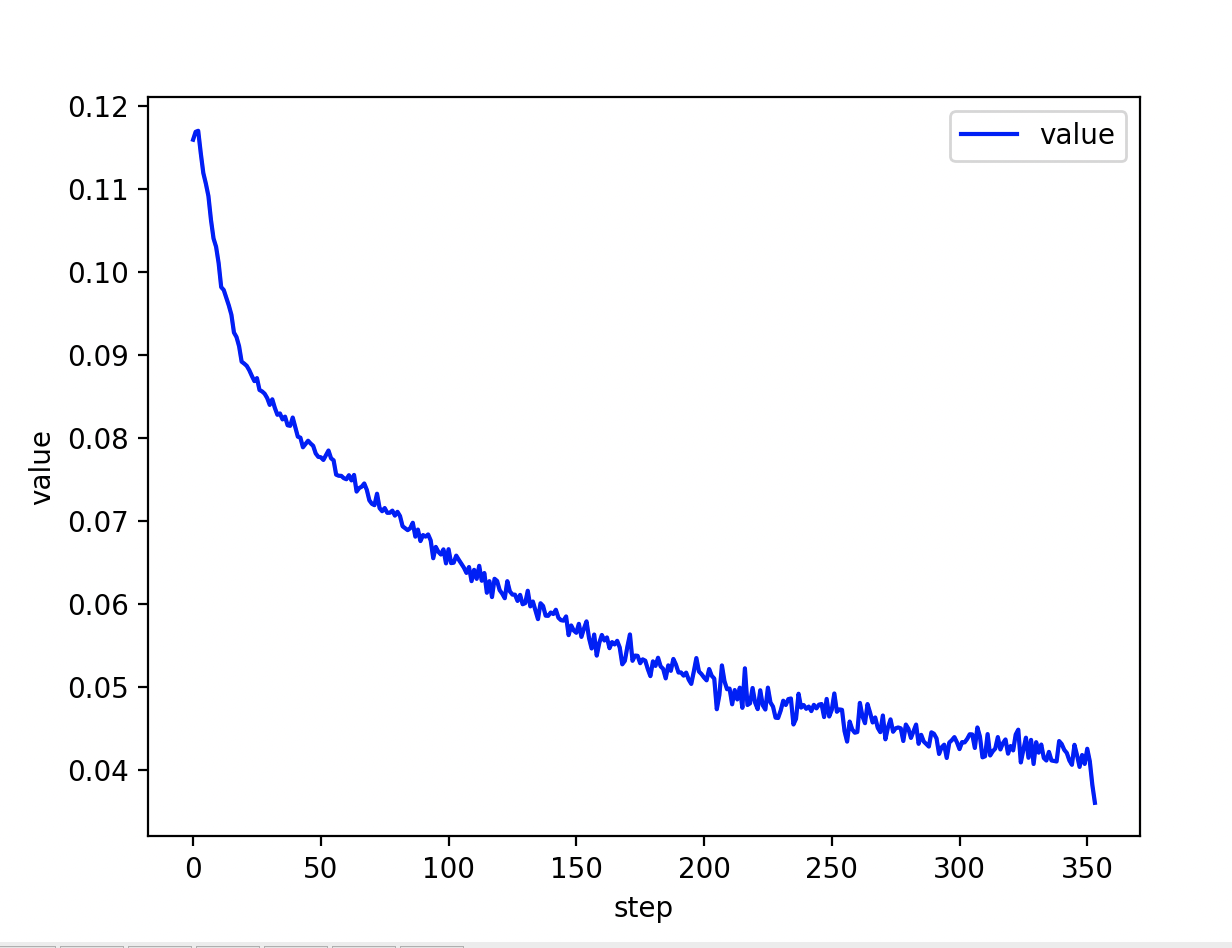
可以看到输出中最后的 loss 损失已经降低到0.041778046637773514 了,那么接下来我们使用测试数据,对我们的这个模型预测进行评测,看看在测试数据上,我们的准确值能达到多少?
四、测试
和训练的时候一样,咱们可以先把测试的数据先加载进来:
test_loader = torch.utils.data.DataLoader(
    torchvision.datasets.MNIST('./data', train=True, download=True,
                               transform=torchvision.transforms.Compose([
                                   torchvision.transforms.ToTensor(),
                                   torchvision.transforms.Normalize(
                                       (0.1307,), (0.3081,)
                                   )
                               ])),
    batch_size=batch_size, shuffle=False
)
接着循环测试数据,并且使用我们之前声明的网络 net 来进行预测,获取到其中预测可能性最大的当做输出的 label
# step 4 : 准确度测试
total_correct = 0
for x, y in test_loader:
    x = x.view(x.size(0), 28 * 28)
    out = net(x)
    # argmax返回这个维度中间值最大的那个索引,dim=1 表示从索引等于1中返回此列的最大值
    # out:[b, 10] => pred: [b]
    pred = out.argmax(dim=1)
    # 计算统计 pred 预测值和真实 label 相等的总数
    correct = pred.eq(y).sum().float().item()
    total_correct += correct

total_num = len(test_loader.dataset)
acc = total_correct / total_num
print('test acc: ', acc)
测试结果的准确性是:
test acc: 0.8378666666666666
让人振奋的是,我们仅仅使用了三层的线性卷积就能达到 83% 的准确性!!不过我们还需要看看,究竟是哪些图片是这个网络结构所不能识别的,所以可以用图的方式看看和预测值有啥不一样~
# 随机取一个 batch 数据,来进行预测
x, y = next(iter(test_loader))
out = net(x.view(x.size(0), 28 * 28))
pred = out.argmax(dim=1)
predict_plot_image(x, pred, 'test predict')
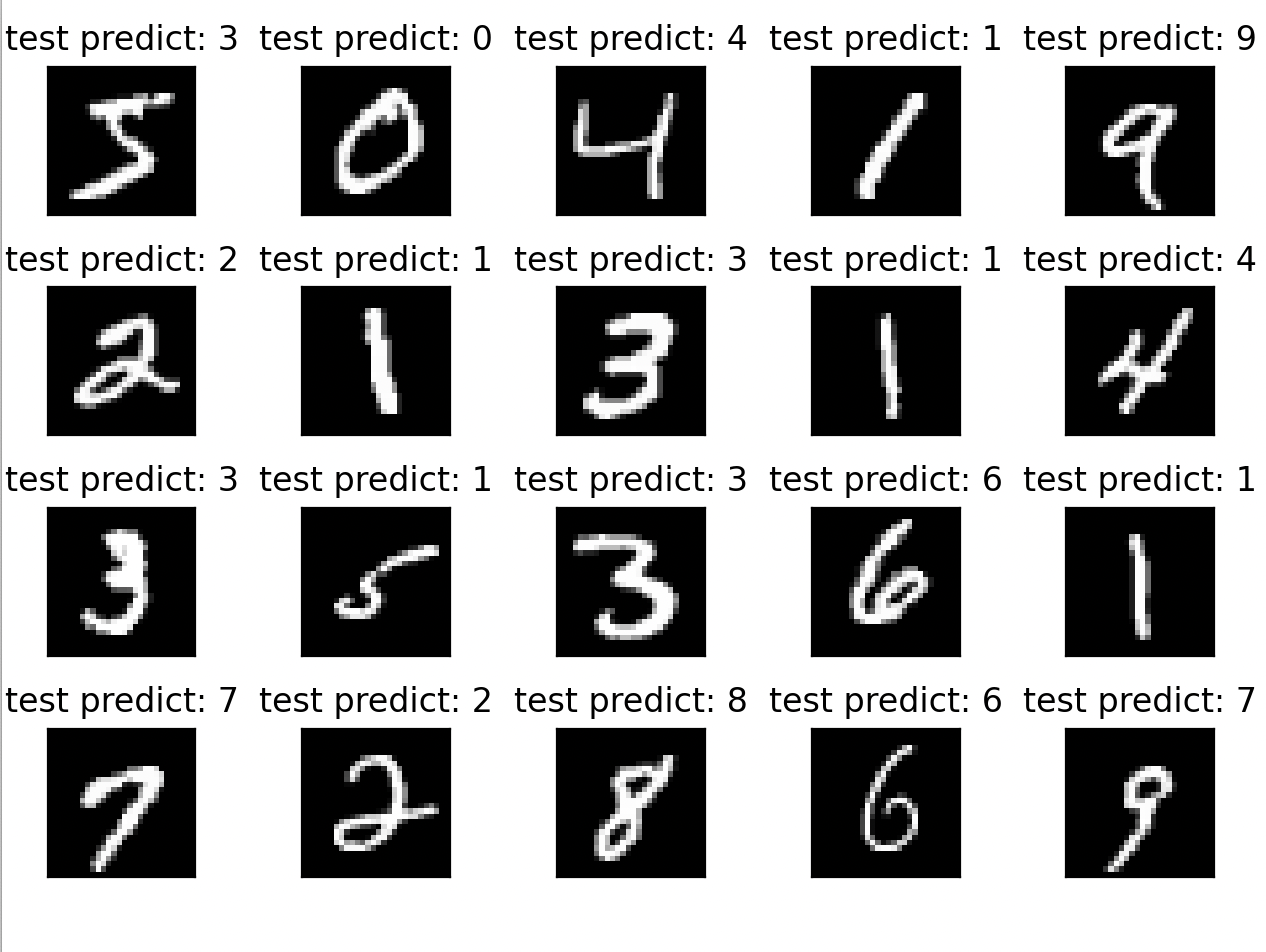
可以观察到从20个图片预测中,这里就有两个是预测错误的,对于非常规的写法,比较潦草的手写,此网络结构下的分类还是会出现错误的。我们可以考虑使用更高级的网络结构来处理识别,比如 CNN 、GNN 等等。
五、 代码
完整代码如下:
import torch
from torch import nn
from torch.nn import functional as F
from torch import optim
import torchvision
from matplotlib import pyplot as plt
from utils import plot_curve, plot_image, one_hot, predict_plot_image

# step 1 : load dataset
batch_size = 512
# https://blog.csdn.net/weixin_44211968/article/details/123739994
# DataLoader 和 dataset 数据集的应用
train_loader = torch.utils.data.DataLoader(
    torchvision.datasets.MNIST('./data', train=True, download=True,
                               transform=torchvision.transforms.Compose([
                                   torchvision.transforms.ToTensor(),
                                   torchvision.transforms.Normalize(
                                       (0.1307,), (0.3081,)
                                   )
                               ])),
    batch_size=batch_size, shuffle=True
)

test_loader = torch.utils.data.DataLoader(
    torchvision.datasets.MNIST('./data', train=True, download=True,
                               transform=torchvision.transforms.Compose([
                                   torchvision.transforms.ToTensor(),
                                   torchvision.transforms.Normalize(
                                       (0.1307,), (0.3081,)
                                   )
                               ])),
    batch_size=batch_size, shuffle=False
)

# 展示一个 batch 的图片
x, y = next(iter(train_loader))
print(x.shape, y.shape, x.min(), x.max())
# torch.Size([512, 1, 28, 28]) torch.Size([512]) tensor(-0.4242) tensor(2.8215)
# 512张图,1通道,28*28像素,label大小512
plot_image(x, y, 'image sample')


# step 2 : 网络
class Net(nn.Module):
    def __init__(self):
        super(Net, self).__init__()

        # xw+b
        # 28*28 输入, 256 第一层的输出
        self.func1 = nn.Line服务器托管网ar(28 * 28, 256)
        # 64 第二层输出
        self.func2 = nn.Linear(256, 64)
        # 10 分类输出 0~9
        self.func3 = nn.Linear(64, 10)

    def forward(self, x):
        x = F.relu(self.func1(x))
        x = F.relu(self.func2(x))
        x = self.func3(x)
        return x


net = Net()
# [w1, b1, w2, b2, w3, b3] 三个方程中需要优化的对象参数, lr - learning rate
optimazer = optim.SGD(net.parameters(), lr=0.005, momentum=0.9)
train_loss = []


# step 3 : 计算
for epoch in range(3):
    for batch_idx, (x, y) in enumerate(train_loader):
        # x: [b,  1, 28, 28], y: [512]
        # [b,  1, 28, 28] => [b, 784]
        x = x.view(-1, 28 * 28)
        # => [b, 0]
        out = net(x)
        # y_onehot 图片label的向量
        y_onehot = one_hot(y)

        # loss函数方差
        # loss = mse(out, y_onehot)
        loss = F.mse_loss(out, y_onehot)

        # 清零梯度
        optimazer.zero_grad()
        # 计算梯度
        loss.backward()
        # 更新梯度
        optimazer.step()

        train_loss.append(loss.item())

        if batch_idx % 10 == 0:
            print(epoch, batch_idx, loss.item())

plot_curve(train_loss)


# step 4 : 准确度测试
total_correct = 0
for x, y in test_loader:
    x = x.view(x.size(0), 28 * 28)
    out = net(x)
    # argmax返回这个维度中间值最大的那个索引,dim=1 表示从索引等于1中返回此列的最大值
    # out:[b, 10] => pred: [b]
    pred = out.argmax(dim=1)
    # 计算统计 pred 预测值和真实 label 相等的总数
    correct = pred.eq(y).sum().float().item()
    total_correct += correct

total_num = len(test_loader.dataset)
acc = total_correct / total_num
print('test acc: ', acc)

# 随机取一个 batch 数据,来进行预测
x, y = next(iter(test_loader))
out = net(x.view(x.size(0), 28 * 28))
pred = out.argmax(dim=1)
predict_plot_image(x, pred, 'test predict')
工具类方法 utils.py
import torch
from matplotlib import pyplot as plt


def plot_curve(data):
    fig = plt.figure()
    plt.plot(range(len(data)), data, color='blue')
    plt.legend(['value'], loc='upper right')
    plt.xlabel('step')
    plt.ylabel('value')
    plt.show()


# 识别图片
def plot_image(img, lable, name):
    fig = plt.figure()
    for i in range(6):
        plt.subplot(2, 3, i + 1)
        plt.tight_layout()
        plt.imshow(img[i][0] * 0.3081 + 0.1307, cmap='gray', interpolation='none')
        plt.title("{}: {}".format(name, lable[i].item()))
        plt.xticks([])
        plt.yticks([])
    plt.show()


def predict_plot_image(img, lable, name):
    fig = plt.figure()
    for i in range(20):
        plt.subplot(4, 5, i + 1)
        plt.tight_layout()
        plt.imshow(img[i][0] * 0.3081 + 0.1307, cmap='gray', interpolation='none')
        plt.title("{}: {}".format(name, lable[i].item()))
        plt.xticks([])
        plt.yticks([])
    plt.show()

def one_hot(label, depth=10):
    out = torch.zeros(label.size(0), depth)
    idx = torch.LongTensor(label).view(-1, 1)
    out.scatter_(dim=1, index=idx, value=1)
    return out
服务器托管,北京服务器托管,服务器租用 http://www.fwqtg.net
机房租用,北京机房租用,IDC机房托管, http://www.fwqtg.net
iOS Core Animation: Advanced Techniques http://www.cocoachina.com/ios/20150104/10814.html View Larger Image iOS Core Animation: Ad…

