基于WIN10的64位系统演示
一、写在前面
本期开始,我们继续学习深度学习图像目标检测系列,RetinaNet模型。
二、RetinaNet简介
RetinaNet 是由 Facebook AI Research (FAIR) 的研究人员在 2017 年提出的一种目标检测模型。它是一种单阶段(one-stage)的目标检测方法,但通过引入一个名为 Focal Loss 的创新损失函数,RetinaNet 解决了单阶段检测器常面临的正负样本不平衡问题。以下是 RetinaNet 的主要特点:
(1)Focal Loss:
传统的交叉熵损失往往由于背景类(负样本)的数量远大于目标类(正样本)而导致训练不稳定。为了解决这一不平衡问题,RetinaNet 引入了 Focal Loss。Focal Loss 被设计为更重视那些难以分类的负样本,而减少对容易分类的背景类的关注。这有助于提高模型对目标的检测精度。
(2)特征金字塔网络 (FPN):
RetinaNet 使用了特征金字塔网络 (FPN) 作为其骨干网络,这是一个为多尺度目标检测设计的卷积网络结构。FPN 可以从单张图像中提取多尺度的特征,使得模型能够有效地检测不同大小的物体。
(3)预定义锚框:
与其他一阶段检测器相似,RetinaNet 在其特征图上使用预定义的锚框来预测目标的位置和类别。
三、数据源
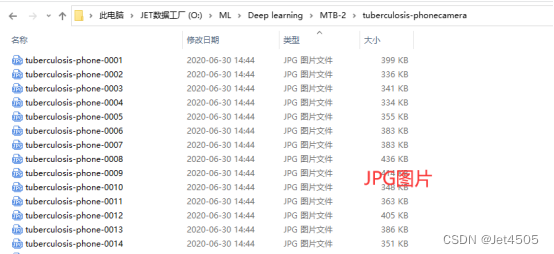
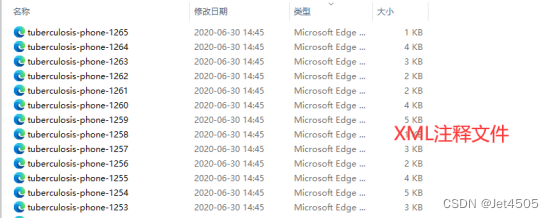
来源于公共数据,文件设置如下:


大概的任务就是:用一个框框标记出MTB的位置。
四、RetinaNet实战
直接上代码:
import os
import random
import torch
import torchvision
from torchvision.models.detection import retinanet_resnet50_fpn
from torchvision.transforms import functional as F
from PIL import Image
from torch.utils.data import DataLoader
import xml.etree.ElementTree as ET
import matplotlib.pyplot as plt
from torchvision import transforms
import albumentations as A
from albumentations.pytorch import ToTensorV2
import numpy as np

# Function to parse XML annotations
def parse_xml(xml_path):
    tree = ET.parse(xml_path)
    root = tree.getroot()

    boxes = []
    for obj in root.findall("object"):
        bndbox = obj.find("bndbox")
        xmin = int(bndbox.find("xmin").text)
        ymin = int(bndbox.find("ymin").text)
        xmax = int(bndbox.find("xmax").text)
        ymax = int(bndbox.find("ymax").text)

        # Check if the bounding box is valid
        if xmin  max_iou:
                    max_iou = iou
                    if iou > iou_threshold:
                        matched = True

            total_iou += max_iou
            if matched:
                TP += 1
            else:
                FP += 1

        FN += len(gt_boxes) - TP

    precision = TP / (TP + FP) if (TP + FP) != 0 else 0
    recall = TP / (TP + FN) if (TP + FN) != 0 else 0
    f1_score = (2 * precision * recall) / (precision + recall) if (precision + recall) != 0 else 0
    mean_iou = total_iou / (TP + FP) if (TP + FP) != 0 else 0

    return precision, recall, f1_score, mean_iou

def evaluate_model(model, dataloader, device):
    model.eval()
    model.to(device)
    all_predictions = []
    all_ground_truths = []

    with torch.no_grad():
        for images, targets in dataloader:
            images = [image.to(device) for image in images]
            predictions = model(images)

            all_predictions.extend(predictions)
            all_ground_truths.extend(targets)

    precision, recall, f1_score, mean_iou = calculate_metrics(all_predictions, all_ground_truths)
    return precision, recall, f1_score, mean_iou


train_precision, train_recall, train_f1, train_iou = evaluate_model(model, train_loader, "cuda")
val_precision, val_recall, val_f1, val_iou = evaluate_model(model, val_loader, "cuda")

print("Training Set Metrics:")
print(f"Precision: {train_precision:.4f}, Recall: {train_recall:.4f}, F1 Score: {train_f1:.4f}, Mean IoU: {train_iou:.4f}")

print("nValidation Set Metrics:")
print(f"Precision: {val_precision:.4f}, Recall: {val_recall:.4f}, F1 Score: {val_f1:.4f}, Mean IoU: {val_iou:.4f}")

#sheet
header = "| Metric    | Training Set | Validation Set |"
divider = "+----------+--------------+----------------+"

train_metrics = f"| Precision | {train_precision:.4f}      | {val_precision:.4f}          |"
recall_metrics = f"| Recall    | {train_recall:.4f}      | {val_recall:.4f}          |"
f1_metrics = f"| F1 Score  | {train_f1:.4f}      | {val_f1:.4f}          |"
iou_metrics = f"| Mean IoU  | {train_iou:.4f}      | {val_iou:.4f}          |"

print(header)
print(divider)
print(train_metrics)
print(recall_metrics)
print(f1_metrics)
print(iou_metrics)
print(divider)

#######################################Train Set######################################
import numpy as np
import matplotlib.pyplot as plt

def plot_predictions_on_image(model, dataset, device, title):
    # Select a random image from the dataset
    idx = np.random.randint(50, len(dataset))
    image, target = dataset[idx]
    img_t服务器托管网ensor = image.clone().detach().to(device).unsqueeze(0)

    # Use the model to make predictions
    model.eval()
    with torch.no_grad():
        prediction = model(img_tensor)

    # Inverse normalization for visualization
    inv_normalize = transforms.Normalize(
       服务器托管网 mean=[-0.485/0.229, -0.456/0.224, -0.406/0.225],
        std=[1/0.229, 1/0.224, 1/0.225]
    )
    image = inv_normalize(image)
    image = torch.clamp(image, 0, 1)
    image = F.to_pil_image(image)

    # Plot the image with ground truth boxes
    plt.figure(figsize=(10, 6))
    plt.title(title + " with Ground Truth Boxes")
    plt.imshow(image)
    ax = plt.gca()

    # Draw the ground truth boxes in blue
    for box in target["boxes"]:
        rect = plt.Rectangle(
            (box[0], box[1]), box[2]-box[0], box[3]-box[1],
            fill=False, color='blue', linewidth=2
        )
        ax.add_patch(rect)
    plt.show()

    # Plot the image with predicted boxes
    plt.figure(figsize=(10, 6))
    plt.title(title + " with Predicted Boxes")
    plt.imshow(image)
    ax = plt.gca()

    # Draw the predicted boxes in red
    for box in prediction[0]["boxes"].cpu():
        rect = plt.Rectangle(
            (box[0], box[1]), box[2]-box[0], box[3]-box[1],
            fill=False, color='red', linewidth=2
        )
        ax.add_patch(rect)
    plt.show()

# Call the function for a random image from the train dataset
plot_predictions_on_image(model, train_dataset, "cuda", "Selected from Training Set")


#######################################Val Set######################################

# Call the function for a random image from the validation dataset
plot_predictions_on_image(model, val_dataset, "cuda", "Selected from Validation Set")
这回也是需要从头训练的,就不跑了。
服务器托管,北京服务器托管,服务器租用 http://www.fwqtg.net
目录 1.双向链表的结构 2.实现双向链表 2.1 要实现的目标 2.2 创建+初始化 2.2.1 List.h 2.2.2 List.c 2.2.3 test.c 2.2.4 代码测试运行 2.3 尾插+打印+头插 思路分析 2.3.1 List.h 2.3…

